Introduction
This short analysis builds upon the work of an original case study published by Texas A&M University-Commerce in The Journal of Competency-Based Education titled, “Competency‐based education: An evolutionary higher education business model”. This update includes the actual financial data of years five and six of the program operations which were forecasted numbers in the original piece. Therefore, this new analysis includes six years’ worth of financial data for the program.
The purpose of the study was, and continues to be, to analyze revenues, costs, and expenses incurred for the state of Texas’ first public and regionally accredited CBE degree program, delivered at Texas A&M University-Commerce. The analyses included in this study encompass the entirety of the program, from inception to current state, and reveal that the CBE program has grown to be self-sustaining within five years.
In the sixth year, enrollment trends continued upward, showcasing an increased return on investment for the university by year end. This study supports the notion that institutions should expect a CBE program of this type to break‐even by the fifth year of operation (Desrochers & Staisloff, 2016). In our case, the latter two years have already recouped the entire loss as the program reached scale.
This work continues to attempt to serve as a foundation of exploration and reporting of evolutionary business models related to innovative approaches in higher education. This paper does not provide A&M‐Commerce’s internal Profit & Loss statement, instead it offers a summary of main components through a variety of charts and graphs. The sequence follows a traditional P&L layout and data have been expressed in a condensed format. For an introduction of the original study and program description please access it here.
Semester Credit Hour Production
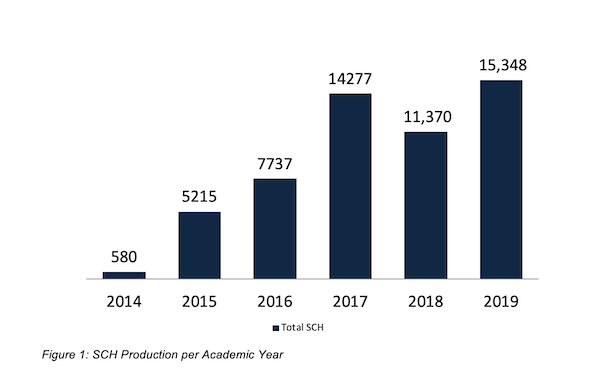
Figure 1 shows semester credit hour (SCH) production of students enrolled in the program each academic year since inception. Beginning with 580 SCH in year one (2014), the program has expanded to fifteen, 348 SCH at the end of 2019, the program’s sixth year of operations. The significant growth in student enrollment generated a massive spike in SCH production in the first four years. The program experienced a slight decrease from academic year 2017 to 2018 largely due to two factors:
1. The removal of a 7th term during the winter mini break that significantly complicated program reporting and financial aid.
2. Down time of another full 7-week term in the summer as program faculty redesigned courses and transitioned them into a new learning management system.
After the changeover to the new platform was completed, the program once again experienced growth from 2018 to 2019. It is important to note that as the program reaches maturity, the growth is happening at a more moderate pace.
Full-Time Student Equivalents
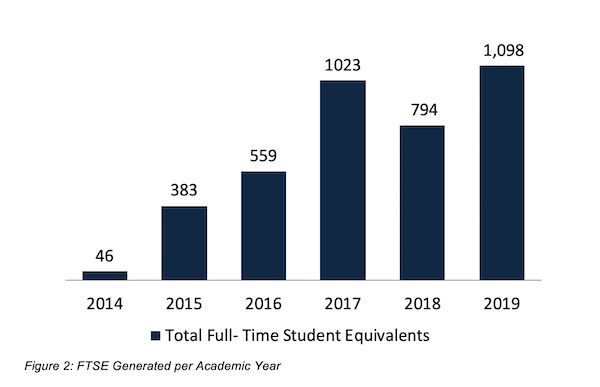
Figure 2 displays full-time student equivalents (FTSE) produced in the program each academic year since inception. Growing from 46 FTSE during year one (2014), the program reached 1,098 FTSE at the end of 2019. Since FTSE is derived from SCH, there is a similar growth and decline trends in relation to SCH, therefore the same factors mentioned above affecting SCH also affected the growth of FTSE. Again, it is important to note that as the program reaches maturity, the growth is happening at a more moderate pace than the initial four years.
Revenues
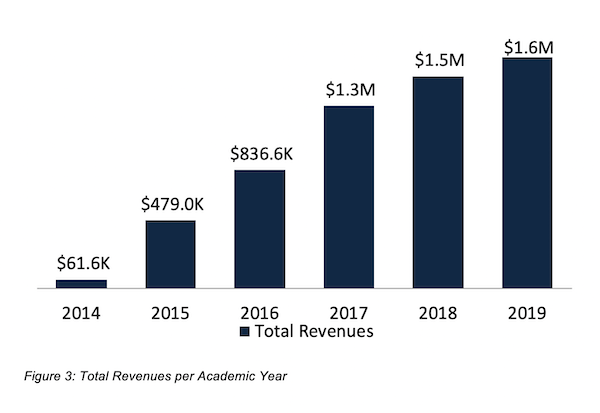
Total revenues for program result from the $750 flat rate for each seven‐week term. With six terms throughout the full year, a student that enrolls for each term through the year would incur a maximum of $4,500. They would also be allowed to accelerate or decelerate at a flexible pace they fully control. Figure 3 displays total revenues generated by the program per each academic year since inception. From $61.6 K generated in revenues during year one (2014), the program grew to $1.6 M by the end of 2019. At full scale with close to 450 enrolled students, the program has continued to experience considerable revenue growth as we head into academic year 2020.
Direct Costs
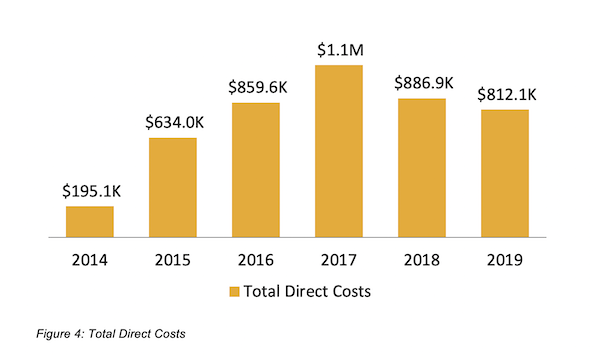
Figure 4 displays total direct costs incurred by the program per each academic year since inception. Direct costs started at $195 K during year one (2014) and have continued to grow, exceeding $1.1 M at the end of 2017. Similar to Total Revenues, due to the growth in student enrollment, the program experienced a massive spike in costs from year one through year four. In 2018 however, the program removed its dependency on service agreements from vendors that provided educational resources and content for instruction embedded into the technological platforms, and began to use Open Education Resources (OER). Working directly with program faculty and a CBE consultant, program leaders generated cost savings by reducing reliance on prior services that had costs in excess of $290K. It’s important to note that our OER initiative also generated savings to students who did not have to pay for any book out-of-pocket. In academic year 2019, direct costs continue in a decline pattern. Revenue generation growth is expected to continue to exceed that of total direct cost now that the program is at full scale.
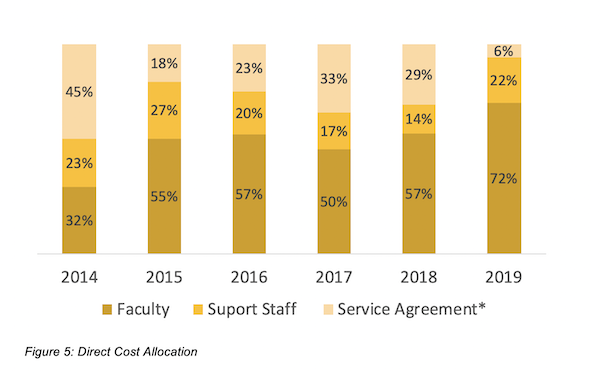
Direct Cost Allocation
Direct costs for the program primarily center on three major categories: faculty, support staff, and service agreements. Figure 5 shows direct cost allocation expressed in percentage of the total direct cost figures noted previously. Faculty cost allocation has continued to rise over time from 32 percent in 2014, to representing 72 percent of all direct costs by 2019. Currently, two professional-track faculty positions teach in the program and provide orientation sessions to new students.
The program uses existing faculty — university staff who meet The Southern Association of Colleges and Schools Commission on Colleges credentialing requirements — and adjunct faculty who are paid an overload of $250 per student enrolled, up to the adjunct faculty rate of $2,500. Enrollment is capped at 35 students per course, and costs associated with support staff have remained fairly constant at an average of 20 percent over six years. The program has one success coach at a ratio of 450 to 1, but this individual is still able to deliver a personalized experience to each student since a lot of the heavy lifting happens during the first four 7-week terms when students are new to the program. Our data supports that CBE students who stay enrolled after term six (one year) usually become more independent and complete their degree. Not surprisingly, what we have experienced is that faculty cost will rise gradually over time as program enrollment scales. Still, support staff costs have remained fairly constant over time. Finally, as program leadership continue to implement cost saving activities such as OER, service agreements have gone down from 45 percent in 2014 to only 6 percent as of 2019 representing significant savings to the institution and students.
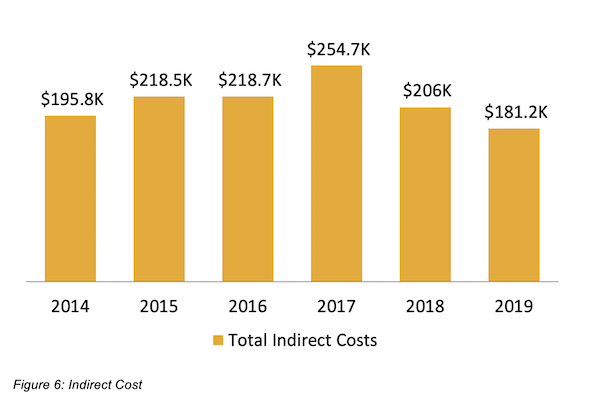
Indirect Costs
Figure 6 displays total indirect costs incurred by the program per each academic year since inception. Indirect costs began at $195.8 K during year one (2014) and have remained steady over time, actually decreasing to $181.2 K as of 2019. Indirect costs are expected to remain consistent over time as departments work together to standardize, automate and improve some of the manual intensive business processes related to the program’s overall operation which we will discuss more in detail in the following sections.
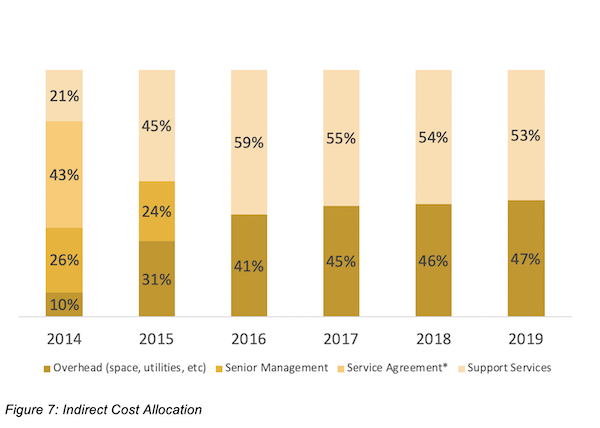
Indirect Cost Allocation
Indirect costs derive primarily from four major categories including the following: overhead, senior management, service agreements, and support services. Figure 7 shows indirect cost allocation expressed in percentage of the total indirect cost figures noted previously. Senior management involvement has reduced from 26 percent and 24 percent for 2014 and 2015. After the program was fully launched, this cost was excluded. In 2014, Service agreement costs were itemized as an indirect cost to the program, but as service agreement related expenses grew, these costs were fully transitioned as a direct cost to the program for the following years as detailed in the direct cost allocation section. Overhead, which only represented 10 percent the first year of operations, has increased to 47 percent as of 2019. University support services, which represented 21 percent for the first year, have grown to 53 percent by 2019, reflecting the largest indirect cost for the program, hence the importance of cross-departmental collaboration.
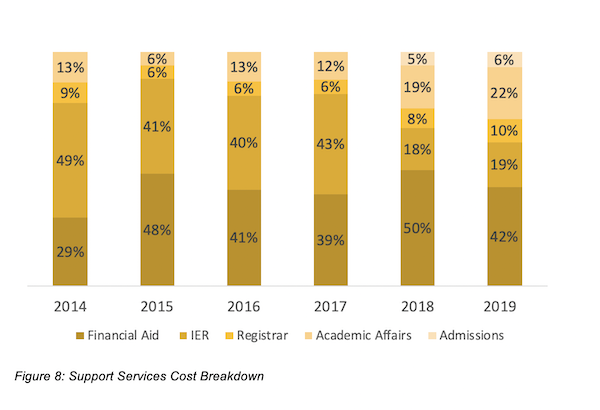
Since support services represent such a large portion of the indirect cost, it was broken down into further sub-categories displayed in Figure 8. Implementing a new innovative program touches many areas on campus. You’ll need to get key stakeholders involved in the process early, in order to identify the cost and lift of launching these programs. You will be asking departments who have probably been doing the same operations for the past decade, to adapt to a completely different model. Getting them involved early helps avoid problems once your program is operational.
Financial aid cost continues to be the programs largest indirect cost at 42 percent as of year 2019. This includes indirect cost application for the Department of Financial Aid and Scholarships as a whole, and the salary for a full‐time financial aid employees allocating a time commitment of 95 percent toward CBE program processes that are, for the most part, still manually intensive. The manual processes incurred by the Office for Institutional Effectiveness and Research (IER) have also contributed to indirect costs, but have significantly gone down in large part due to automation. What use to be a 43 percent indirect cost of IER support services for 2017 is now only 19 percent by year 2019.
The registrar’s office also accounts for support services: what was 6 percent of indirect cost at launch has gone up to 10 percent as the program continues to scale. The academic affairs division support of the program, across a variety of responsibilities, has also grown under new program leadership, and now represents 22 percent of indirect cost an increase from 13 percent in 2014.
Finally, admissions have been added as an indirect cost for 2018 and 2019, as this new study shows admissions offices investing 5-6 percent of their time working directly on CBE applications. It is important to note that Support Services are campus services that serve the university as a whole, which were created in an attempt to identify and allocate in consideration of a specific program. The program continues to work with different campus partners to automate business processes and streamline solutions in order to reduce the burden and indirect costs to departments.
Program Net Profit/(Loss) Before Formula Funding
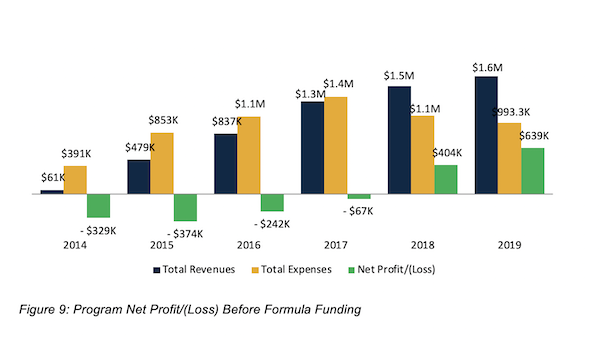
After four years’ experience a net loss, Figure 9 displays the program’s net profit/(loss) statement showing a net profit for its last two years of operations, even before formula funding considerations. Program expenses exceeded that of revenues up until the point the program scaled and reached its breakeven point of 350 students per term which happened right around 2017. As the program continued to scale, and total tuition revenues grew at a faster pace than expenses, the program experienced a net profit of $404K and $639K in 2018 and 2019 respectively, significantly exceeding forecasted numbers from the original study.
Formula Funding Revenue
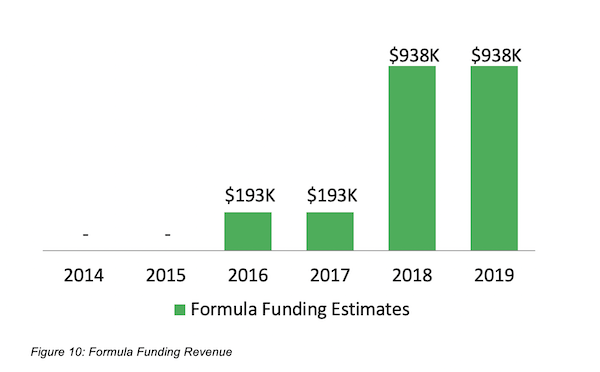
Recent formula funding calculations also outperformed all forecasted numbers from the original study. Due to the significant scale in student enrollment and accelerate pace of course intake, the total semester credit hour production and FTSE have grown exponentially over the last two years. Total formula funding for the period amounts generated to approximately $938 K for each year of the biennium as shown in Figure 10. Total formula funding generated went up by a whopping 386 percent in comparison to the previous biennium.
Program Net Profit/(Loss) After Formula Funding Revenue
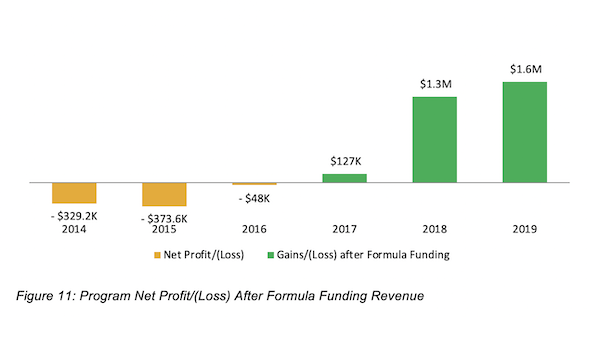
Figure 11 shows the actual gain/(loss) for the new biennium. The CBE program produced a gain of $1.3 M for 2018, and $1.6 M for 2019 after formula funding, again beating all forecasted numbers from the original study. In 2018, after being operational for five years, the program recouped losses from all prior years.
Conclusion
Although there are many different versions of CBE program delivery, it is important for institutions to realize that subscription models rely on both economies of scale and efficient use of time and resources by program faculty and staff to minimize costs. Using this work as a foundation, the Competency-Based Education Network (CBEN) created a return on investment (ROI) Estimator and a user guide designed to help institutions calculate and predict the ROI and break-even point for CBE programs and potential new workforce partnership programs. In this specific case, short-run expenses exceeded revenues. However, in the long-run, revenues and expenses gradually grew together as the program scaled reaching a tipping point in which revenues significantly exceed expenses.
Leadership teams need to recognize that while the initial years of the program might be a financial burden to the institution, early evidence shows that institutions should expect a competency-based program of this type to break-even by the fifth year of operation. At A&M-Commerce, 350 enrolled students was the break-even point. Today, with close to 500 students enrolled, the CBE program is now the third largest program at the university, and profitable with tuition revenue alone.
In Texas and other states, it is also important to consider that due to the accelerated nature of these programs, they are high formula funding generators that bring in a significant source of additional revenue. Institutions should also consider building a CBE infrastructure they can leverage to build future programs. For example, A&M-Commerce decided to build the core curriculum from inception. While this was a huge upfront lift for the institution, the work is now paying off as the institution moves towards building new CBE programs. The university has recently launched a second program in Criminal Justice that will not only scale faster, but will be profitable faster as well. The plan is to build 10 new CBE programs at the A&M-Commerce campus that will operate out of the new College of Innovation and Design where the Institute for Competency-Based Education is housed.
Finally, although this short study showcases the financial return on investment for the institution, this return has also exceeded all expectations for students. Approximately 62 percent of students graduate within two years and an average a cost to degree of under $6,000. CBE students are not only accelerating time to degree by at least 20 percentage points in comparison to similar students enrolled in more traditional completer programs, but doing so for half the cost. The next article in this series will focus on metrics showcasing the ROI for CBE students highlighting the key difference with students in a more traditional setting.
You Might Also Like