Published on
Becoming a Data-Driven Organization: Evolving the Continuing Education Unit

In an increasingly competitive education and training landscape, lifelong learning providers must seek novel ways to attract and engage potential students. Stanford University’s School of Engineering, through its extended education unit, the Stanford Center for Professional Development (SCPD), has developed a multipronged marketing strategy to expand its future market and attract the right students to its programs. The SCPD has learned a number of key lessons in developing and executing its marketing strategy. In this article, I will outline our new focus on the customer lifecycle and data analytics, which has helped propel enrollments as well as allowed for an analysis of student behavior that guides future marketing investments.
The Stanford Center for Professional Development (SCPD) annually delivers 35 part-time Master of Science degrees, 222 graduate and professional courses, and 23 graduate and professional certificates to technical professionals, managers and executives from more than 800 companies worldwide. Courses are delivered online via streaming video, on-campus at Stanford, and at company worksites. In addition to its fee-based portfolio, which includes 10,000 hours of online video-based education, the SCPD portfolio also includes Stanford seminars, symposia and conference proceedings that are distributed online at no cost. Over 12,000 industry students from 40 countries enroll annually in graduate and professional education courses delivered by the SCPD.
Every year, the SCPD is held accountable to the following criteria in its support of industry and university collaborations:
- Promote Stanford’s academic departments, centers, institutes, and faculty.
- Build and strengthen Stanford’s industry, government, higher education, alumni, and prospective student connections and relationships.
- Apply new pedagogical approaches, distance education applications, and e-learning tools.
- Generate revenue for participating departments, centers, institutes, and faculty.
The organization has evolved core competencies to support these various dimensions, including content creation and delivery, student registration, and support and marketing, which is arguably the most important. Often marketing is viewed as more art than science, but with new tools to help collect and analyze data, the SCPD has been able to extract valuable insights to evaluate campaigns, make critical ‘on the fly’ adjustments, and make better, more informed marketing investment decisions.
Data and Decisions
To extract relevant data, the SCPD created a team affectionately known as the Data Crunchers in 2009 to manage the overall data capture and extraction. Their charge for marketing is to evaluate each marketing channel’s overall effectiveness, from first contact to registered student. While easy to articulate, achieving this objective took quite a bit of effort. Historically, the SCPD has relied on a variety of marketing tactics to attract its student population. Measuring the return on investment of every marketing channel has now become an important part of SCPD’s investment strategy. We developed a simple internal statement to guide the marketing team: “If you can’t measure it, you can’t do it.”

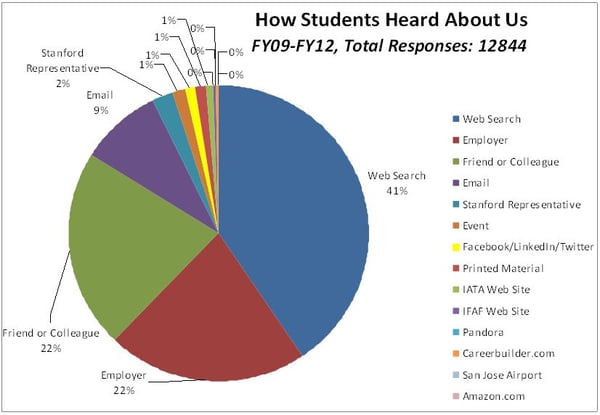
We began by assessing how enrolled students had heard about SCPD based on various existing marketing activities to establish benchmark data (Figure 1, above. For a more detailed look at the variable success of our marketing initiatives, please click here). We measured channels where the majority of our marketing spending was focused, such as email, employer communication, printed materials, presentations by Stanford representatives, web search, events (such as company information sessions), social networking, and friend or colleague recommendations. This became an important baseline evaluation tool for existing channels, which we continue to measure today.
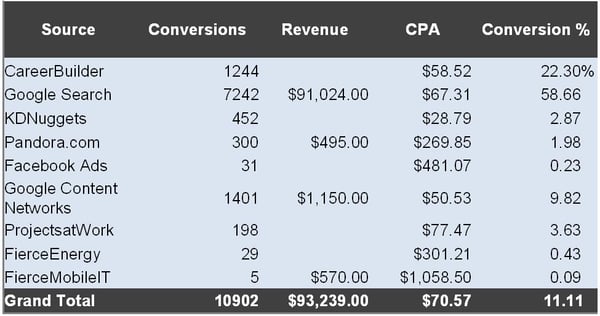
Next, SCPD needed to redefine the goals of its marketing activities and the metrics for each activity (email, web search, social networking, print, et cetera) to ensure that our marketing expenditure was yielding the expected results. We also wanted to measure a few experiments, such as a billboard campaign, to see if new or different channels offered any insights. The Data Crunchers team developed a tool (Figure 2) to assess the particular channel, conversion rates, direct revenues (if any), cost-per-acquisition (CPA), and conversion percentage per channel. This resulted in the ability to measure the goal of an activity (awareness, enrollments, informational, mailing list signups) by different metrics such as reach, conversions, and impact on enrollments. Further, we weighted each conversion by likelihood to generate an enrollment. With this tool, we could fairly rapidly determine whether to increase or reduce investment for a certain marketing activity based on the cost per conversion. We also incorporated into our CPA the level of staff effort expended based on the number of hours spent on a particular tactic.

Webinars
One of the most valuable tools SCPD has developed to support our conversions has been our free webinars. The webinars were initially created to offer prospective students a free, one-hour educational experience, with 45 minutes of new content, and a five minutes to inform prospective students how to register for the course or program. SCPD began these efforts in 2006, and before implementing analytics, there was some question from our faculty and staff about the utility of hosting these free, one-hour events. This effort required significant time to engage faculty, develop new content, and create awareness for the webinar itself. While it was easy to measure webinar enrollments—participants had to register for the webinar in our database system to “attend”—it was more difficult to determine whether or not webinars were converting attendees to enrollees.
Before we made the decision to reduce or stop producing webinars, we asked the Data Crunchers team to explore whether or not there was any connection between webinars and enrollments. Webinars had enrollments and most of our email and web-based campaigns featured webinars as a potential way for prospects to engage with us. But was the level of effort worth these free enrollments?
The team analyzed enrolled students whose first enrollment was a free webinar to determine if they paid for a course following this experience. The team looked at the dataset beginning in September, 2008—when we installed registration software at SCPD. The results were surprising. Not only were webinars helping conversions for emails and banner ads by giving prospects a first taste of Stanford content, but webinars were driving enrollments across a broad range of products. Since we began measuring webinars, we realized they were generated over $3M in revenue to both graduate and professional education offerings. Interestingly, management topics from Stanford’s Department of Management Science and Engineering led to enrollments in other SCPD portfolio areas such as computer science and electrical engineering. What began as an informational activity for our professional certificates had been clearly validated as an extremely valuable recruiting tool across the SCPD portfolio. As a consequence of this data, we increased the number of webinars annually from four per year to 20 per year and have consistent registrations of 1000 per webinar, with a range of 28-42 percent attendance at the actual event.
Conclusions
As SCPD has grown its portfolio, we have become a more data-driven organization, thanks in part to the registration database system, which has archived SCPD’s current and historical data, and to a dedicated group interested in providing answers to challenging business questions. Education providers like SCPD invest significant time and expense to develop and market their portfolio of offerings. It is imperative therefore that we measure where we are making investments. Today we have institutionalized many of those data sets into our own dashboard, which we review in weekly meetings, so we can expand successful efforts, make changes to those channels which are not working, and allow for new experiments as audience preferences change. Furthermore, as an organization, we have begun to change the culture from an advocacy model (s/he who screams the loudest gets the cool marketing campaign) to one where strategic and tactical decisions are informed by evidence we have collected.
Author Perspective: Administrator


