
The first installment of this series, Personalization at Scale: Two Institutional Journeys, described the similarities and differences between two adult-serving online institutions, and the organizational capacity for leveraging data and technology to support learners. The second installment, Personalization at Scale: Using Metrics to Improve the Student Experience, described how data analytics can identify and support learners’ needs, especially in the first term, to set them up for success. In this third and final installment of the Personalization at Scale series, we further explore how each of our institutions leverage data analytics to move from operational reporting to predictive and prescriptive models.
Analytics
The term “analytics” can have multiple meanings depending on the context. According to Gartner, it is has emerged as a catch-all term for a variety of different business intelligence (BI)- and application-related initiatives and is increasingly used to describe statistical and mathematical data analysis that clusters, segments, scores and predicts what scenarios are most likely to happen. In higher education, academic analytics refer to the collection, analysis or use of institutional-level effectiveness data and metrics by administrators, policy-makers, and regulators. Learning analytics aims to “improve student performance in individual courses, by measuring, collecting, analyzing and reporting data related to student learning, participatory, and performance‐related behaviours” (Long & Siemens, 2011).[1]
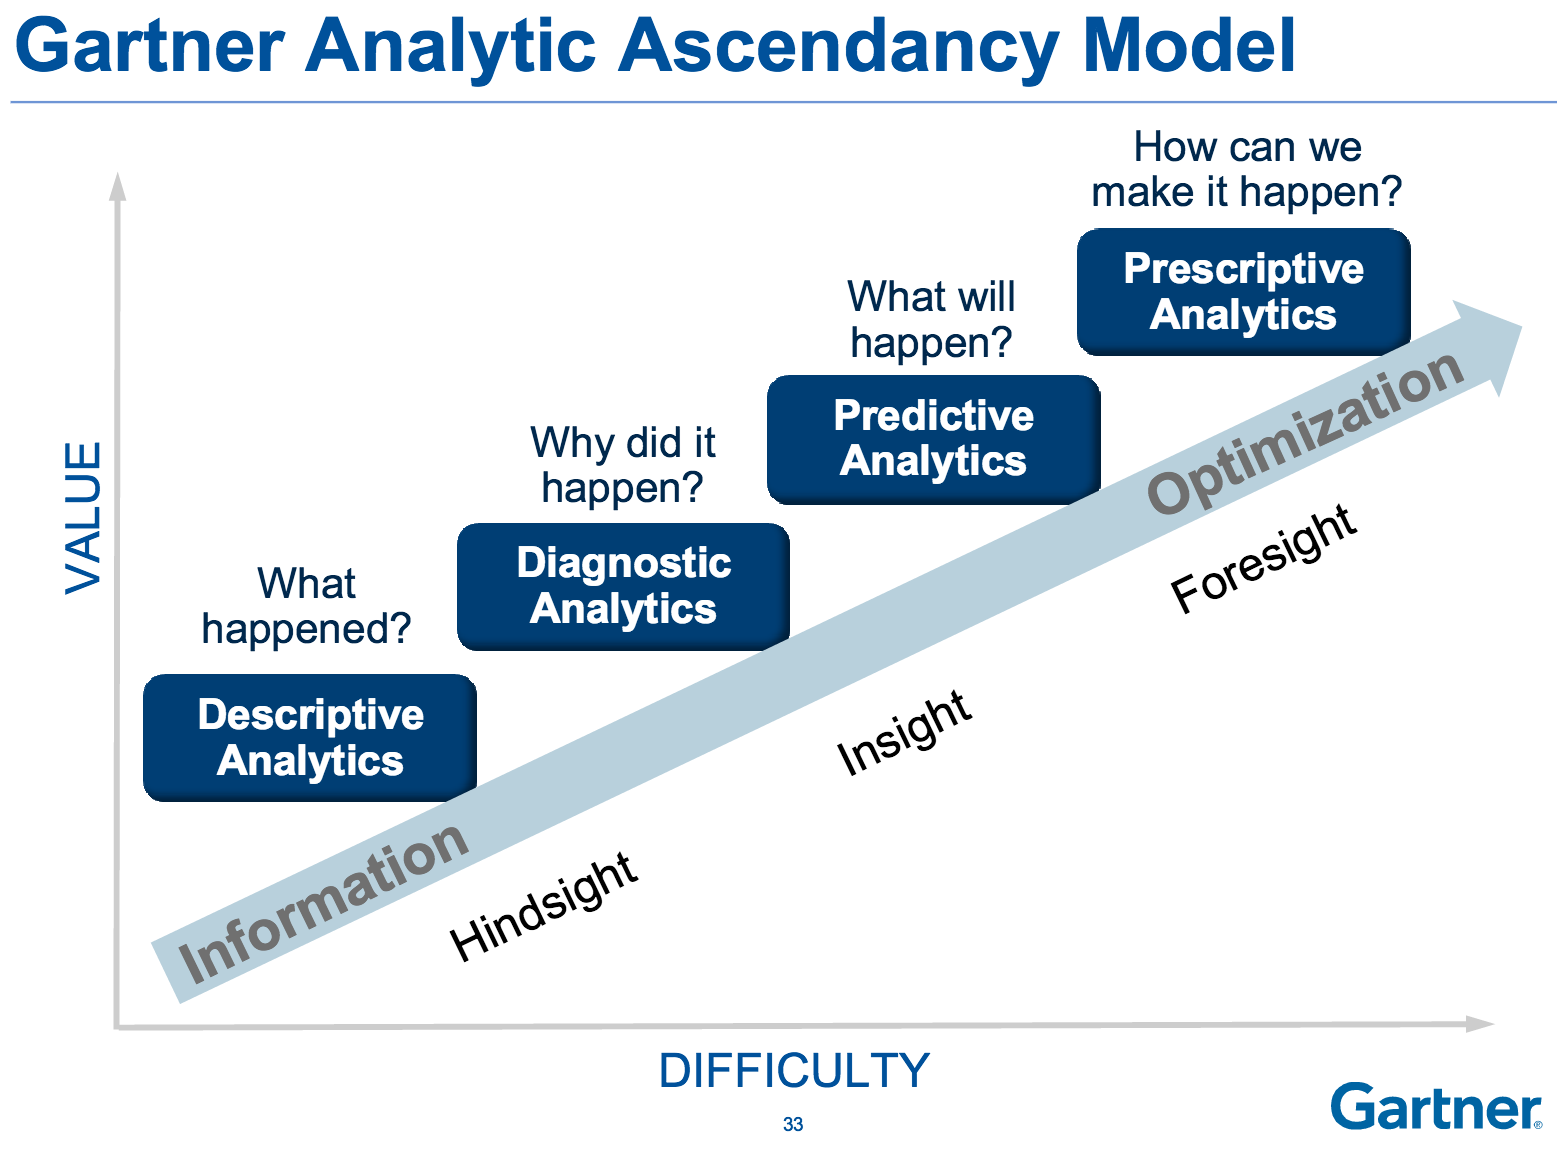
In 2013, Gartner presented an analytics maturity model to help organizations gain value from higher levels of analytic maturity, moving from information and hindsight to optimization and foresight in increasing complexity, effort and value. Each analytic type builds on the prior ones.
In 2015, Linda Baer and Donald Norris explored student success initiatives across the U.S. and found that the gap is widening between those out in front in analytics-informed student success and their peer institutions. According to Norris:
“There is a visible shift from using analytics solely to report what has happened as with the performance metrics gleaned from descriptive and diagnostic analytics, to the more insightful and actionable insights and foresight provided by predictive and prescriptive analytics.” [2]
Capella University and University of Maryland University College are leaders in the use of data and analytics. Both universities are evolving from operational reporting to adding strategic analytics and moving toward prescriptive analytics.
Capella University
Capella University collects and stores enormous amounts of data. Capella has the expected troves of data, such as when learners log into their online courserooms, when learners submit assignments, what learners’ grades are, and what learners’ registration patterns are. Capella also has deeper data, such as instructors’ written feedback on assignments, the content of questions and responses in the “Ask Your Instructor” section of the courseroom, and the reasons why and when learners spoke with their advisors. As a competency-based university, Capella has data on how well learners demonstrate competencies across their courses in their programs.
These rich data provide endless opportunities for analytics, from descriptive through prescriptive. Capella has two primary challenges (in addition to the human resources capacity to analyze such large data):
- The availability of the data in forms available for analysis
- Ensuring that the data and analytics are used for action
To address the first challenge, Capella’s analytics teams have developed close partnerships with internal IT and business intelligence teams. Analytics is at the table when it comes to making decisions on data availability, the structure of data tables, and the ways in which data are connected. Capella has an enterprise data warehouse, where much of the data used every day in reporting across the university are stored. Developing the data and analytic software infrastructure was a five-year project, and there is ongoing IT investment to maintain, upgrade, and add to Capella’s systems and data tables. Even with this cleaned data warehouse, Capella still has a large portion of data stored in source systems, which can be messy and challenging to access and understand. Here again, Capella’s analytics teams rely on close ties with IT as well as their own advanced analytic expertise and software tools.
The second challenge, using analytics for action, has been a focus of recent efforts. Capella’s early analytic work focused on descriptive analytics and diagnostic analytics, and then Capella dove into predictive analytics by hiring an internal predictive analytics team. More recently, Capella has made greater use of prescriptive analytics as part of increased computing capability, analytic talent, and most importantly, support from ongoing university-wide efforts to increase learner persistence and graduation rates. Additionally, Capella’s analytic teams continue to work towards operating as consultants and partners to teams across the university. As opposed to a “drive through” service where data or analysis requests are dropped off, Capella’s analysts are either embedded in key strategic teams (such as learner success) or operate as consultants, having conversations about the data and collaborating on the best approach to helping solve a particular business problem.
In planning predictive and prescriptive analytics, Capella had a concerted focus on the action that could be taken. Rather than starting with the sheer volumes of data and what analysts could possibly do, Capella started with the goals (what behaviors we want to change or influence), then explored what data can help either show progress or execute on these goals, and only as a last step, deciding the best technology and analytic tools that can do the predictive and prescriptive analytics. Key to the actionability of the analytics, the most effective way Capella has found to encourage leaders to read and use the data and metrics in their decision-making is to integrate it into places they are already looking, rather than pointing leaders to yet another report.
For example, through predictive analytics, Capella has found that learner satisfaction with a course goes up when instructors post a unique welcome message each term in the online courseroom. A goal might be to get 100 percent of instructors to post these welcome messages, the goal being to change instructors’ behaviors from not posting to posting. Rather than sending out yet another report, Capella included this data point in a regular report that department chairs are already looking at. It is up to the chairs to act on the data, but the analytic teams can make it as easy as possible.
UMUC
UMUC continues to improve its analytics capabilities with the goal of creating a seamless environment where the use and application of analytics powers thoughtful interventions based on root cause analysis and external research of what works to increase online learning persistence.
UMUC began with a data warehouse and reporting tool to aggregate data from across the university and developed a single integrated source for institutional information. The university created an Office of Analytics and invested in a sophisticated data infrastructure to provide strategic analysis, reporting, and analytical capabilities and tools to multiple departments to support decision-making. This third-generation data warehouse contains a wealth of data from throughout the University–including financial, student applications, enrollment, marketing, and course/faculty and learning management system (LMS) activity data. It supports analysis on key metrics such as enrollment trends, degrees awarded and retention rates.
Drawing on this data, much information is increasingly provided through “dashboards” of administrative and academic information, organized and disseminated in a visually accessible format. For example, an executive-level dashboard combines enrollment, financial and student success metrics as well as marketing analytics that track spending, applications, enrollments and conversion rates for new students. Academic Program Dashboards for program chairs and deans help to monitor enrollment trends, student outcomes, and faculty performance for each school and program.
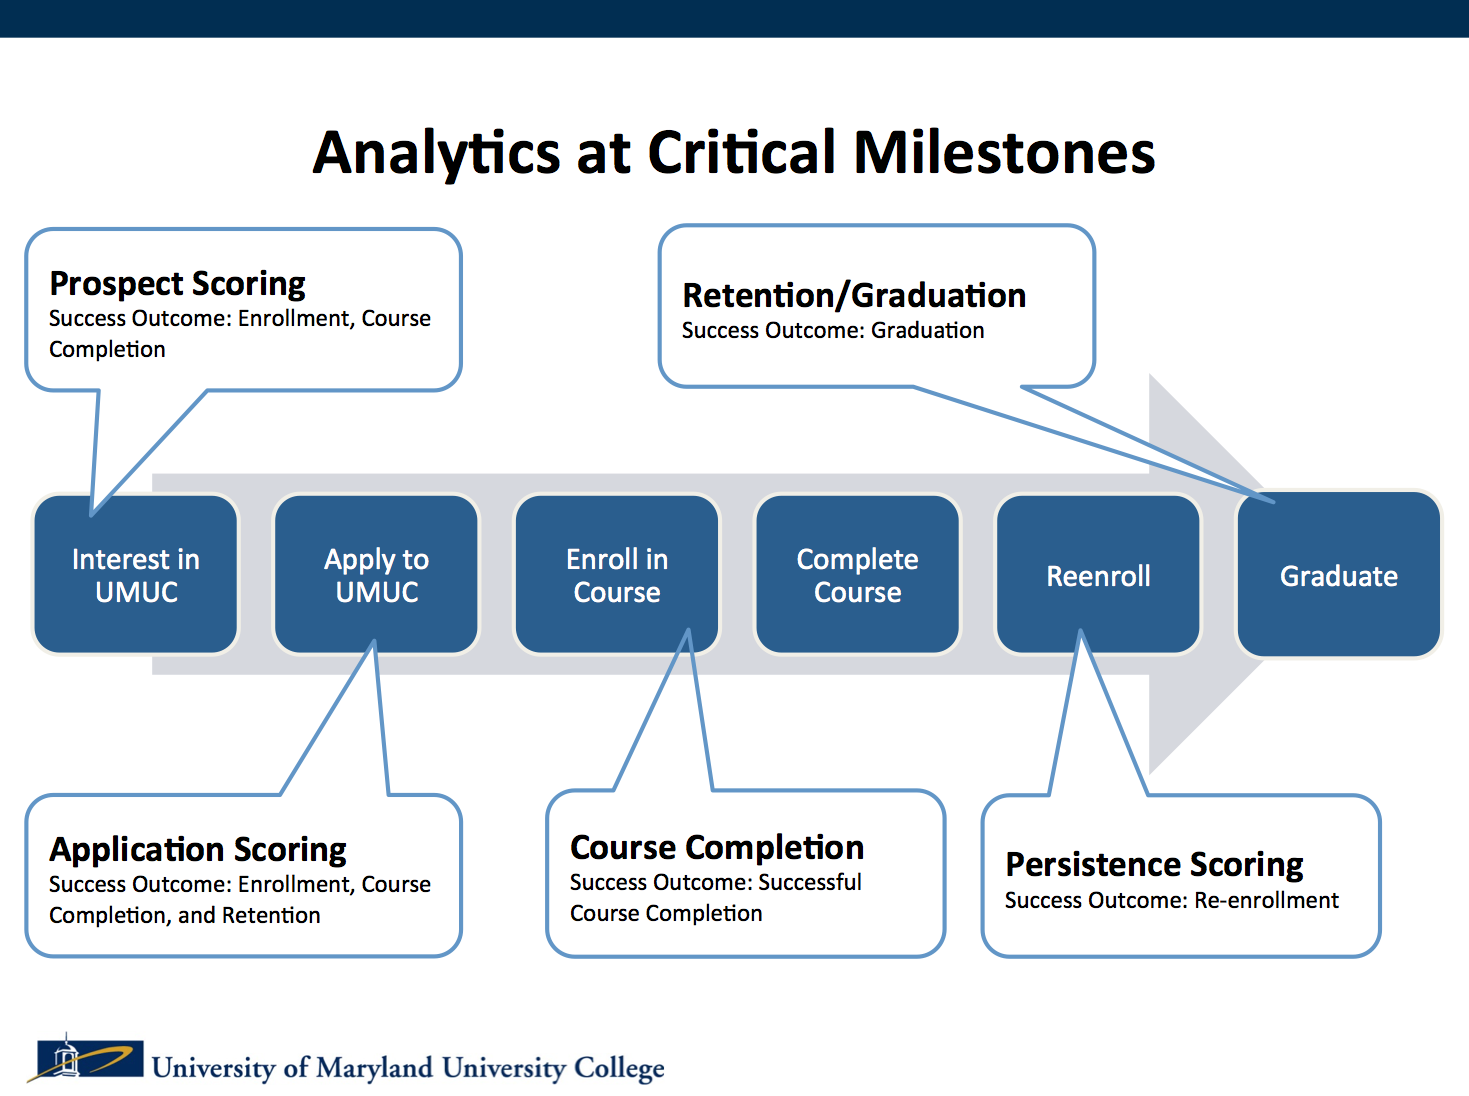
These broad analytics capabilities help the university to manage and monitor not only institutional performance and financial viability, but also the effectiveness of student success efforts. For example, an online learning “test drive” program and a three-credit elective course, intended to help first-in-family and returning adult students to develop skills needed to succeed in higher education, were discontinued and resources moved to other retention initiatives after data indicated that it failed to show a positive lasting impact for most students.
When data showed that students who registered late for classes had a significantly lower probability of success, UMUC approved a new drop/add, which provides students a timeframe during which a course can be dropped without academic or financial penalty and limits a student’s ability to add an online class less than four days before the class begins. One year after the transition, worldwide retention had increased by 5 percentage points and successful course completion (the percentage of course enrollments that resulted in a grade of C or better within the term) had increased by 3 percentage points.
The Center for Innovation in Learning and Student Success (CILSS) continues to pilot research-based interventions to inform UMUC’s next generation learning and academic support models. Planning includes the strategic use of data analytics to improve completion rates for UMUC students by developing a retention model to identify where students are at greatest risk; determine what changes are needed to help students stay on track; assess and evaluate the changes made in order to continuously improve the overall experience; and involve all departments of the university in the process.
Capella and UMUC are institutions that have developed the organizational capacity, as described by Norris and Baer, to leverage analytics by building the technology infrastructure, processes and workflows, expertise, culture, and leadership to sustain innovation and improve student success.
Conclusion
Over the course of this Personalization at Scale series, we have delved into the myriad ways that universities can improve the higher education experience for their students, regardless of the institutional model. Whether for-profit, non-profit or public, colleges and universities across the board would be wise to explore the potential of data analytics to improve institutional efficiency and effectiveness.
– – – –
References
[1] George Siemens and Phil Long (2011), “Penetrating the fog: Analytics in learning and education,” EDUCAUSE Review, 46(5), 31–40. Retrieved from http://er.educause.edu/articles/2011/9/penetrating-the-fog-analytics-in-learning-and-education
[2] Linda Baer and Don Norris (2015), “What Every Leader Needs to Know About Student Success Analytics,” Civitas Learning Space. Retrieved from http://www.civitaslearningspace.com/what-every-leader-needs-to-know-about-student-success-analytics/
You Might Also Like