
It’s no secret that we are currently living in an age of accountability. As new education models come into play, constituents will demand evidence of the effectiveness of these programs.
As you begin the monumental quest of building your institution’s own CBE program, remember, for validity’s sake, you need to start data collection and implementing effective metrics from program inception. Now, it is not enough to collect data. You have to make sure the metrics you put in place will provide tangible evidence that you will be able to accomplish the specific goals you set out to achieve from the beginning. Understanding what data to collect and using metrics right from the start enables data-driven decision making. You should have both short-term and long-term measurements built in to your CBE model, and keep relentless track of progress to enable continuous improvement in your program and business processes.
A major issue that we have seen for current innovative educational models, particularly for Competency-Based Education, is that we have not agreed upon a common framework to measure the effectiveness of these programs. At the Institute for Competency-Based Education, we are currently building a Metrics Framework for our CBE program in Organizational Leadership at Texas A&M-Commerce (TAMU-C). Our framework analyzes three key components since program inception:
1. Student Demographics
2. Program Performance
3. Program Efficiency
The landscape of higher education comes with immense complexity. There can be no one-size-fits-all approach, and therefore we believe this is the perfect starting point to which you can then adjust your parameters to meet the specific needs of your program(s).
Our Model
In our case, the CBE BAAS in Organizational Leadership at TAMU-C was designed specifically to serve the needs of the over 3 million non-traditional, working students in Texas with some college and no degree. It provides an effective and high-quality pathway for stop-outs with more than 50 semester credit hours to return and complete their degree. Our program is a fully online degree consisting of 99 competencies (for the equivalent of 120 SCH). Tuition and fees are fixed at $750 for Texas residents and $2500 for non-residents for each seven-week term. Students may accelerate and complete as many courses as possible for this flat rate.
Therefore our goal from program inception was clear: provide an education pathway for deep pockets of students who otherwise might not have obtained a degree. All our traditional business processes had to be adapted to meet these seven-week term parameters throughout the year. We decided to measure our metrics on a term-to-term basis, and keep running averages of all our metrics to benchmark current performance with historical tendencies.
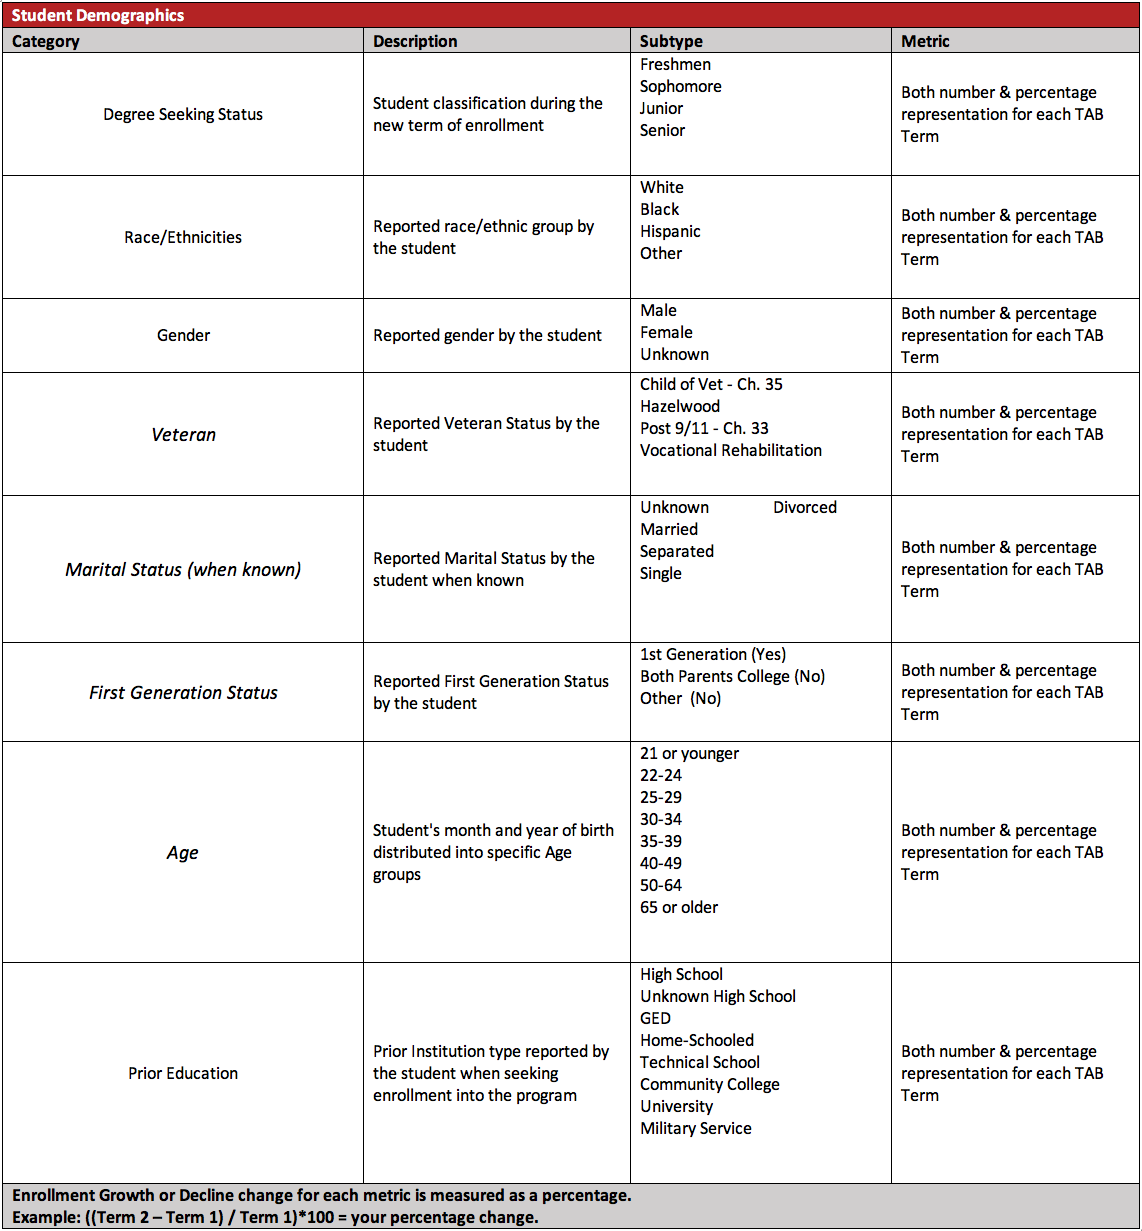
How We Measure: Student Demographics
Our student demographics component on Table 1 measures the usual indicators that you would expect in a traditional program, with a couple of additions to meet our program’s needs. The difference lies in that, traditionally, we are concerned with year-to-year performance. For our CBE program, we measure all our metrics every seven-week term.
Our term-to-term measurements allow us to really grasp if we are on track to accomplishing our overarching goals. For example, analyzing our student classifications has allowed us to identify that, historically, over 85 percent of all enrolled students are already in upperclassmen classifications. Keeping track of age groups allows us to identify that the average age of students in the program is 39, and 92 percent of the students are ages 25 and up. Both these metrics are clear indicators that our program is serving non-traditional/adult learners that need education to adapt to their busy schedules and not the other way around.
Our student population also reflects crucial demographic changes in the state, with 37 percent identifying as minorities. Our target population of educationally underserved adults also includes nearly 11 percent veterans, and 18 percent first-generation students.
One particular metric that was important to us was prior education. It was astounding that even though we do enroll a small portion of high school, GED and home-schooled students, 97 percent of all our students actually bring to us credits from prior higher education institutions. Our students have some credits, but no degree to show for their work. The TAB Program is accomplishing its mission to make higher education available to a broader and changing population in the higher education landscape.
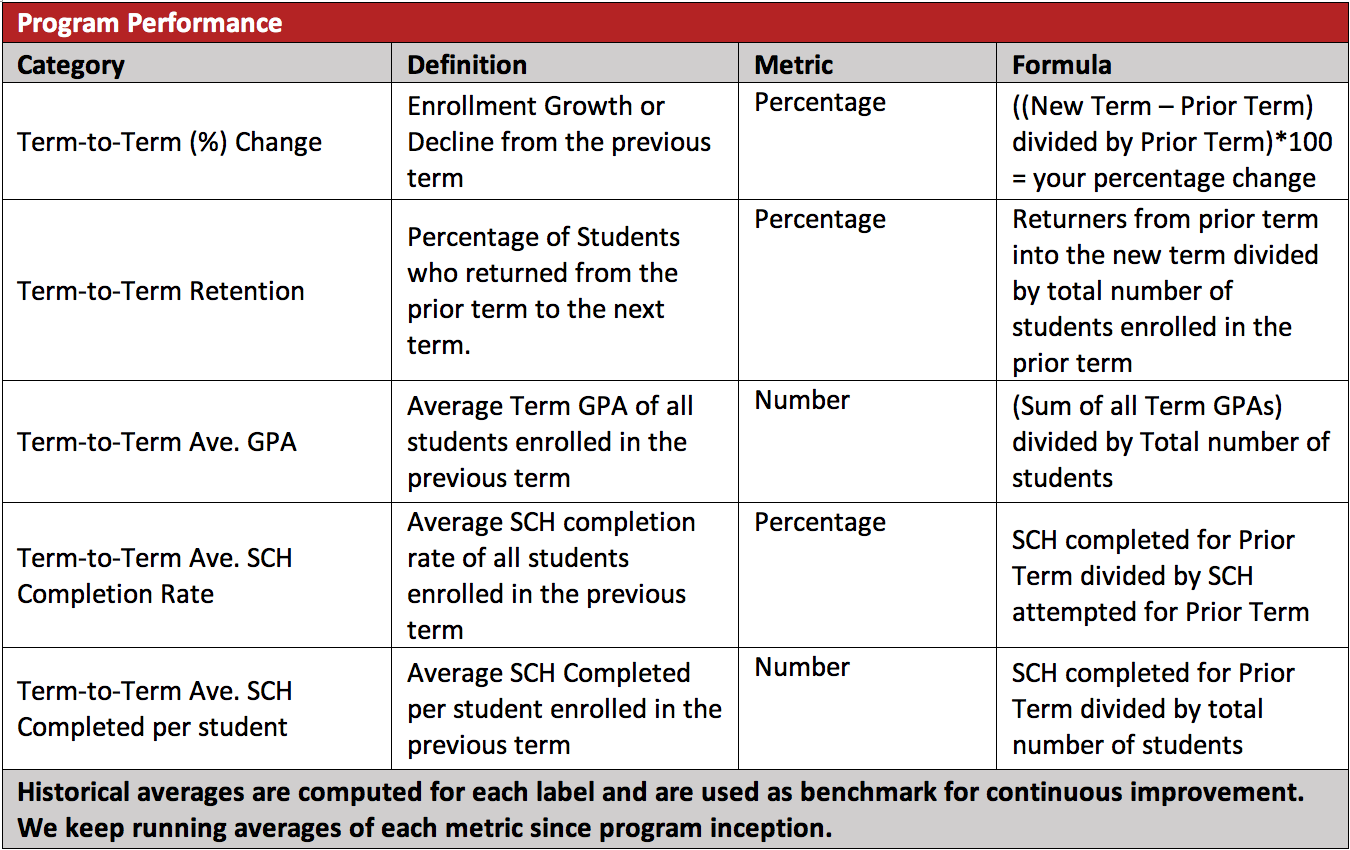
How We Measure: Program Performance
The second critical component is program performance. The metrics on Table 2 allow us to measure term-to-term student success for each of our seven-week terms throughout the year.
Our first metrics show term-to-term growth. We started with just seven students for our first TAB term, and by TAB term 15 we have 200+ enrolled students. We have had an average term-to-term growth change of 30 percent and an overall headcount growth of almost 3000 percent since program inception. TAB students are taking, on average, six SCH per seven-week term and maintaining a 3.05 GPA. Students are being retained at an astonishing running average of 86 percent, and have an average SCH completion rate of 84 percent since program inception.
During each term, we are also measuring financial aid metrics, including Pell Grants, loans, outside scholarships, tuition reimbursement by employers and other aid received.
As of our latest term, 154 students who applied for financial aid, 47 percent received Pell Grants.
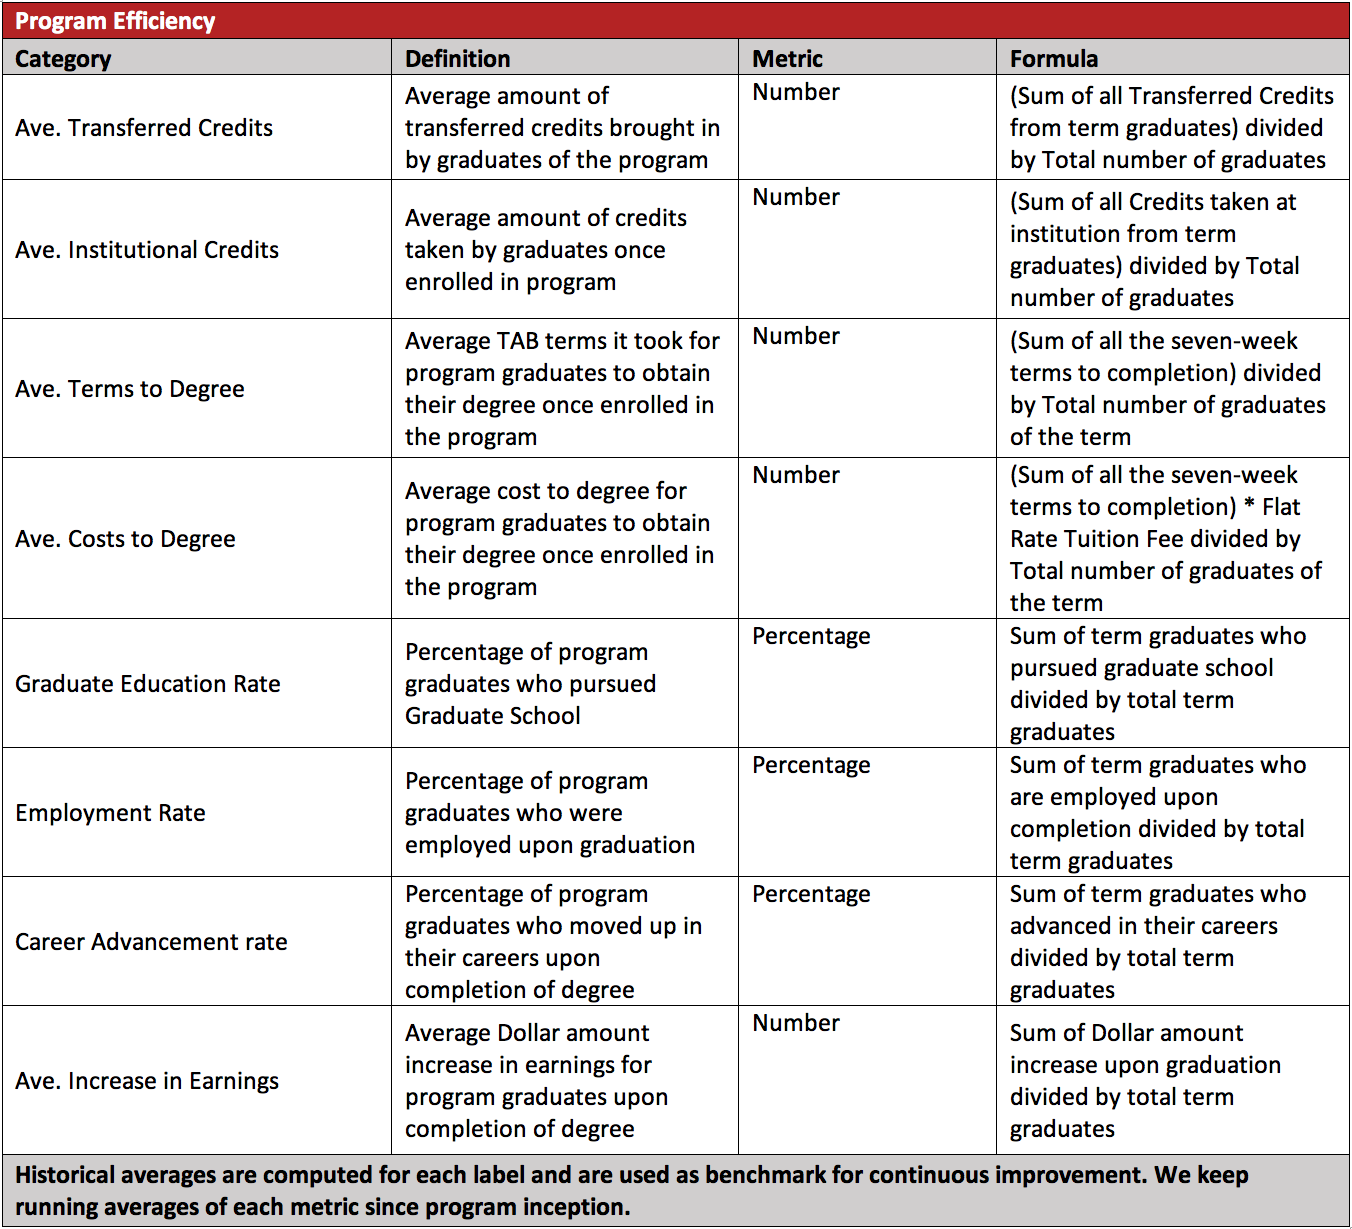
How We Measure: Program Efficiency
Our final component is program efficiency, and in Table 3 we focus on data related to the program’s graduates. While still early in the history of our program, these preliminary findings suggest that CBE is a viable and attractive model to accelerate time to completion and reduce cost to degree.
Currently, 66 students have graduated from the TAB Program. Recent graduate data shows that, on average, these students came to our institution with a significant 87 transfer credits, yet these students graduated in less than a year, with an average of 43 credits taken at TAMU-C in our seven-week terms. On average, they took six terms to graduate, with an average cost of $4,891 to obtain their degrees.
Our data not only suggests that students can accelerate time to degree by a year, but also they are able to do so while saving up to half the cost of a traditional program. We are in the mist of creating a post-graduation survey, to delve into research-related to outcomes. Our plan is to collect data on employment rates, career advancements and increase in earnings, amongst other factors. We will also survey our graduate’s employers to be able to measure workforce performance in comparison to our traditional organizational leadership degrees, which provides the ideal control group.
Insights for the Future
Lastly, I think it is important to mention the importance of building partnerships with those that will be most affected in this complex change from traditional data collection to a CBE approach. Remember, you will be asking departments to adjust methods and techniques that have been done the same way for years.
Key partnerships that I’ve found fundamental to not only collecting data, but also to automating specific data points & processes include our university’s Institutional Effectiveness team, Financial Aid office, and the Advancement office.
The sooner you get key institutional stakeholders involved, the earlier you will be able to adapt your business processes and begin collecting valuable data that may enrich your program’s outcomes and enable student success.
You Might Also Like